“Oh, just get me the CDR‘s and I’ll take it from there” – how many times have I heard these words before? I can’t even imagine the number of times in the past 15 years of IT/Telecom’s work that I’ve done and in the last 8 years of Asterisk in particular – when it comes to billing and fraud management, it would appear that the CDR’s are the Rosetta Stone of the industry.
Over the past 6 months, several of my friends and I had been asking ourselves this question: “Is there more to billing, fraud management and profit leakage? does it really all begins and ends with the CDRs?” – so, here we were, a group of 3 engineers dealing with telecom system and billing systems – we knew that the answer is a definite YES, however, how come most companies and system aren’t even aware of this, in such a way that causes them to leak telecom profits and waste their hard earned profit margins on simple accidental mis-interpretation of CDR records.
So, we’ve decided to sit down and start analyzing calls in real-time, trying to evaluate not only the CDR record that is received upon the completion of the call – but also understand the traversal path of the call, analyzing it in real time and evaluating it profit leakage potential. At the mean time, we’re concentrating our work on Asterisk, as it is the simplest for us to implement – however, we’re not focusing it only on that – we’ll looking at adding it to FreeSwitch, Yate, OpenSer/Kamailio, OpenSIPS and the various varients.
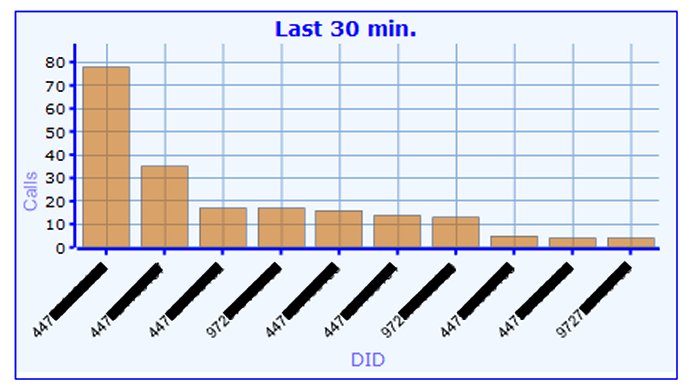
So, what have we done so far? well, one thing we never really had with any of the existing systems was a clear view of what’s going on “right-now” on our systems, so we said: “it would really be great if we could know how many call hits we’ve received during the past 15, 30, 45 or 60 minutes” – so here is what we made:
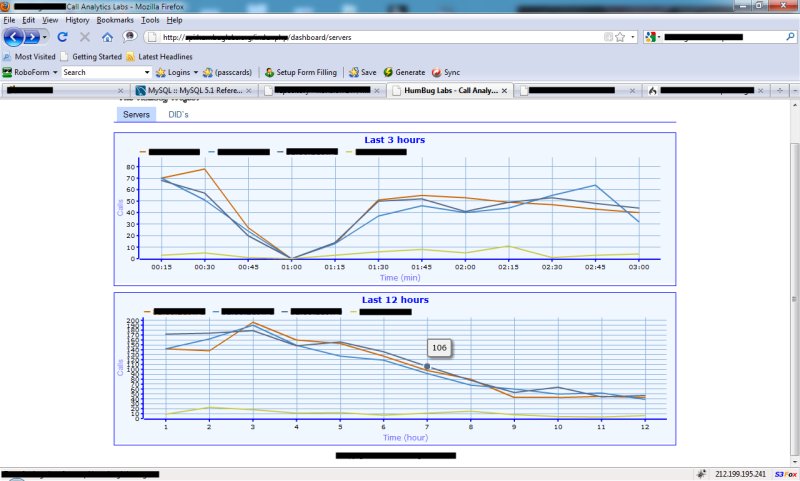
 The above image shows our top 10 inbound DID numbers, as you can see these are in the 972 and 447 country codes (yes, we work mainly in Israel and the UK). At the backend, our servers are analyzing the data in real time, generating an active alert in the case a DID number’s statistics change in a somewhat drastic change, thus, establish a traffic anomaly. Another thing that interested us was our usage across multiple servers, which we are exhibiting in the below graph:
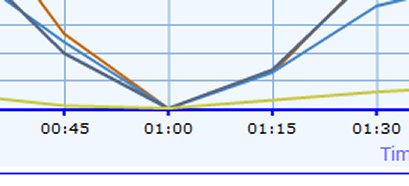
Now, as you can see, the top graph shows a discrete anomaly:
 This anomaly indicates something went wrong on all our servers between 00:45 and 1:15, which gives us a fairly discrete period of time to seek for a problem in the system. What happened was that one of the guys updated a portion of the data traversal API – basically deleting it 🙂 [we resumed full work after about 40 minutes].
So, where is it all going to? well simple, a new Open Source based service that we’ll be launching within a few months from now. Our intention is to provide a means for simple, straight forward, highly reliable, call analytics, fraud management and profit leakage analysis service. A service which is based upon a simple to use API on one hand and Open Source based data gathering agents. Our belief is that by analyzing large amounts of data, from multiple sources around the world, we’ll be able to ascertain the fingerprint of a telecom bound attack – being able to alert the respective users of the service and maybe in the later future, also provide a means to block the attack as it advances across the world.
I’ll be updating about our advancement as we go along, but for the time being, this is something I felt would interest you.

![Reblog this post [with Zemanta]](http://img.zemanta.com/reblog_e.png?x-id=48389df4-cfc0-4a29-999f-bd64ebfa9a06)